metadata
datasets:
  - AnasAlokla/multilingual_go_emotions
language:
  - ar
  - en
  - fr
  - es
  - nl
  - tr
metrics:
  - accuracy
  - f1
  - recall
base_model:
  - google-bert/bert-base-multilingual-cased
pipeline_tag: text-classification
Overview
Model trained from bert-base-multilingual-cased on the multilingual_go_emotions dataset for multi-label classification.
Multilingual GoEmotions Chatbot Task Report
Author: Anas Hamid Alokla
This repository/space contains details about a multilingual emotion classification model and chatbot based on the GoEmotions dataset.
Links
- Live Demo: https://huggingface.co/spaces/AnasAlokla/test_emotion_chatbot
- Dataset (Supports 6 Languages): https://huggingface.co/datasets/AnasAlokla/multilingual_go_emotions
- Model Used: https://huggingface.co/AnasAlokla/multilingual_go_emotions
- GitHub Code: https://github.com/anasAloklah/emotion_chatbot
Test Set Performance
The following table shows the performance metrics of the fine-tuned model on the test set, broken down by emotion category.
| index | accuracy | precision | recall | f1 | mcc | support | threshold |
|---|---|---|---|---|---|---|---|
| admiration | 0.942 | 0.652 | 0.684 | 0.667 | 0.636 | 2790 | 0.4 |
| amusement | 0.973 | 0.735 | 0.817 | 0.774 | 0.76 | 1866 | 0.35 |
| anger | 0.96 | 0.411 | 0.364 | 0.386 | 0.366 | 1128 | 0.35 |
| annoyance | 0.896 | 0.246 | 0.481 | 0.325 | 0.293 | 1704 | 0.15 |
| approval | 0.91 | 0.329 | 0.383 | 0.354 | 0.307 | 2094 | 0.2 |
| caring | 0.958 | 0.285 | 0.46 | 0.352 | 0.341 | 816 | 0.15 |
| confusion | 0.965 | 0.444 | 0.401 | 0.421 | 0.404 | 1020 | 0.25 |
| curiosity | 0.935 | 0.433 | 0.74 | 0.546 | 0.535 | 1734 | 0.25 |
| desire | 0.984 | 0.404 | 0.534 | 0.46 | 0.457 | 414 | 0.25 |
| disappointment | 0.942 | 0.224 | 0.345 | 0.272 | 0.249 | 1014 | 0.15 |
| disapproval | 0.935 | 0.306 | 0.413 | 0.352 | 0.322 | 1398 | 0.25 |
| disgust | 0.975 | 0.343 | 0.418 | 0.377 | 0.366 | 600 | 0.15 |
| embarrassment | 0.99 | 0.28 | 0.242 | 0.26 | 0.255 | 240 | 0.1 |
| excitement | 0.973 | 0.344 | 0.425 | 0.38 | 0.369 | 624 | 0.15 |
| fear | 0.987 | 0.599 | 0.522 | 0.558 | 0.553 | 498 | 0.35 |
| gratitude | 0.989 | 0.924 | 0.902 | 0.913 | 0.907 | 2004 | 0.4 |
| grief | 0.999 | 0 | 0 | 0 | 0 | 36 | 0.05 |
| joy | 0.965 | 0.454 | 0.532 | 0.49 | 0.474 | 1032 | 0.25 |
| love | 0.973 | 0.731 | 0.829 | 0.777 | 0.765 | 1812 | 0.35 |
| nervousness | 0.996 | 0.385 | 0.25 | 0.303 | 0.308 | 120 | 0.1 |
| optimism | 0.973 | 0.588 | 0.525 | 0.555 | 0.542 | 1062 | 0.25 |
| pride | 0.997 | 0 | 0 | 0 | 0 | 84 | 0.05 |
| realization | 0.962 | 0.202 | 0.189 | 0.195 | 0.176 | 792 | 0.15 |
| relief | 0.996 | 0 | 0 | 0 | 0 | 138 | 0.05 |
| remorse | 0.988 | 0.597 | 0.808 | 0.687 | 0.689 | 516 | 0.15 |
| sadness | 0.97 | 0.548 | 0.434 | 0.484 | 0.473 | 1062 | 0.4 |
| surprise | 0.974 | 0.487 | 0.569 | 0.524 | 0.513 | 828 | 0.3 |
| neutral | 0.726 | 0.551 | 0.818 | 0.658 | 0.468 | 10524 | 0.2 |
Fine-tuning Performance
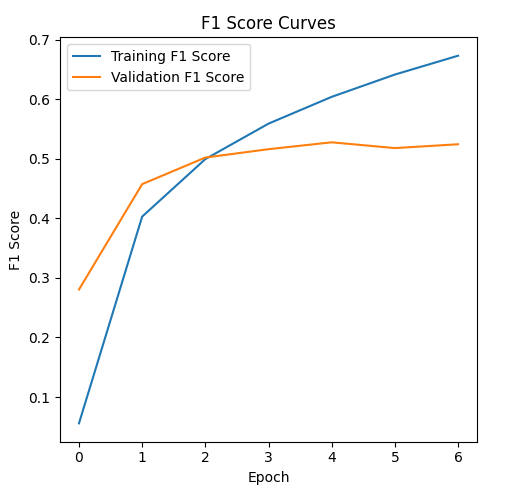
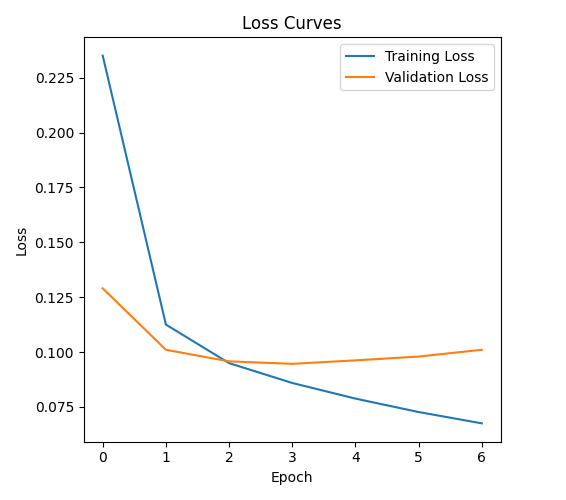
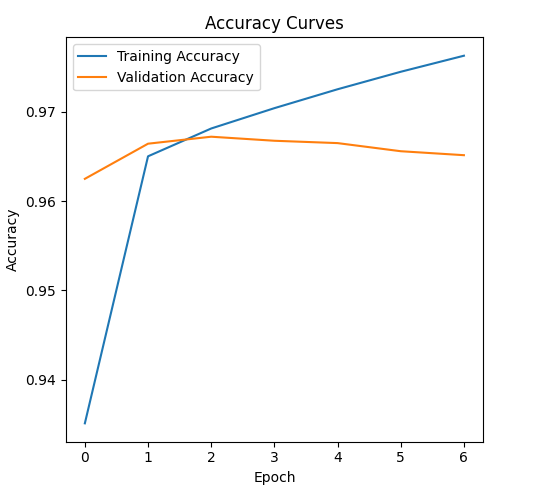
The following plots visualize the model's performance during the fine-tuning process across epochs.
Loss Curves (Training vs. Validation)
Accuracy Curves (Training vs. Validation)
F1 Score Curves (Training vs. Validation)