Datasets:
Dataset Card for BOOM (Benchmark of Observability Metrics)
Dataset Summary
BOOM (Benchmark of Observability Metrics) is a large-scale, real-world time series dataset designed for evaluating models on forecasting tasks in complex observability environments. Composed of real-world metrics data collected from Datadog, a leading observability platform, the benchmark captures the irregularity, structural complexity, and heavy-tailed statistics typical of production observability data. Unlike synthetic or curated benchmarks, BOOM reflects the full diversity and unpredictability of operational signals observed in distributed systems, covering infrastructure, networking, databases, security, and application-level metrics.
Note: the metrics comprising BOOM were generated from internal monitoring of pre-production environments, and do not include any customer data.
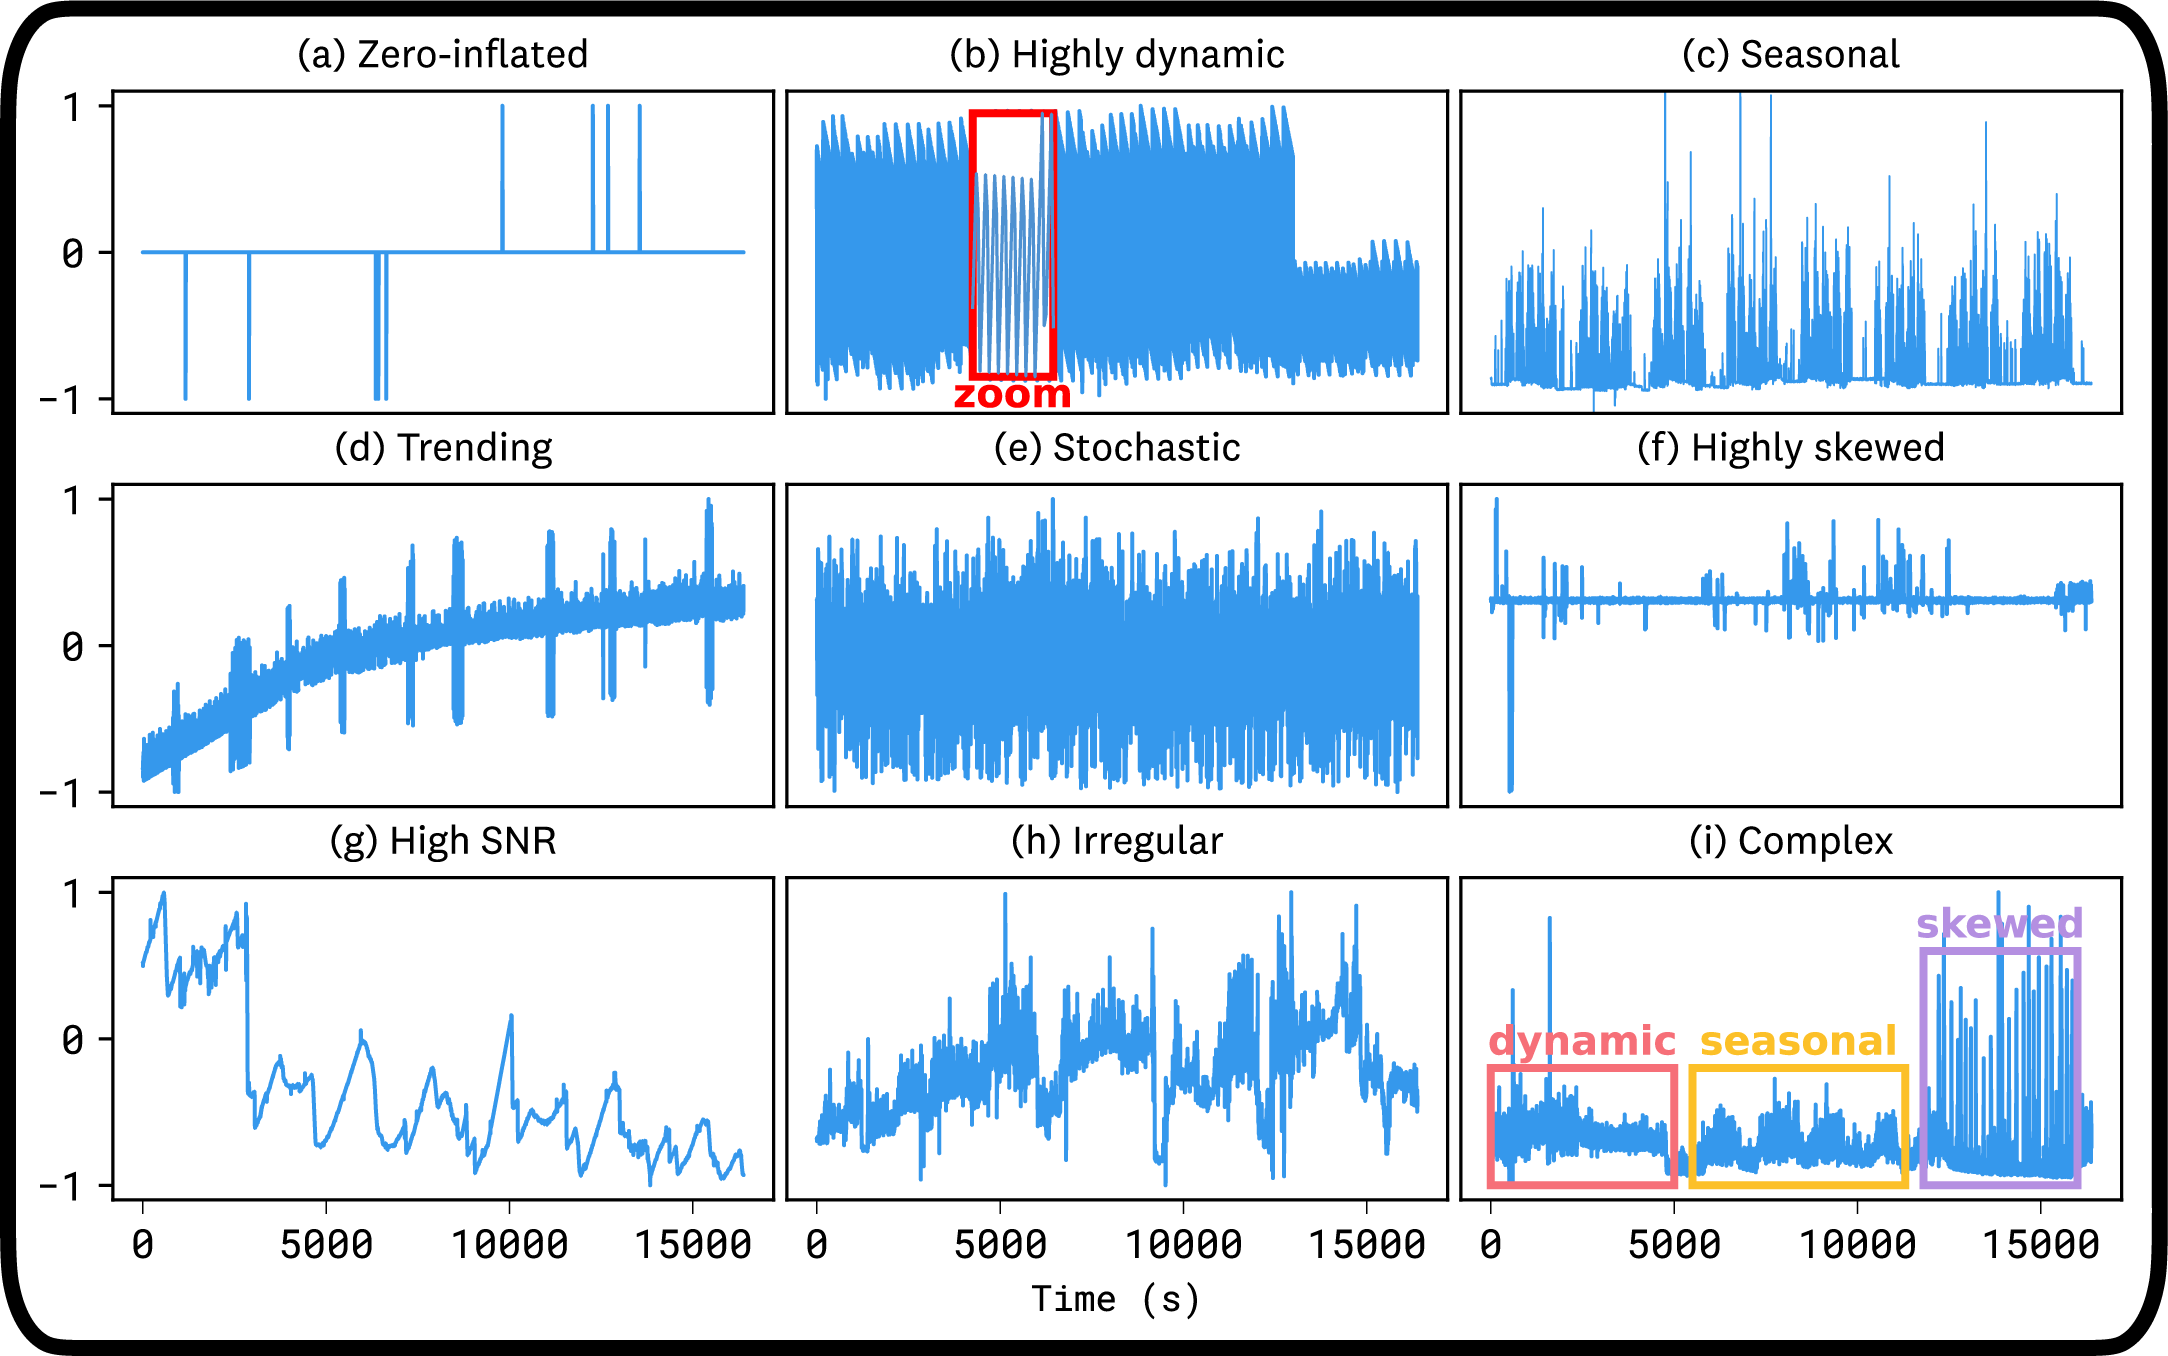
Boom consists of approximately 350 million time-series points across 32,887 variates. The dataset is split into 2,807 individual time series with one or multiple variates. Each represents a metric query extracted from user-generated dashboards, notebooks, and monitors. These series vary widely in sampling frequency, temporal length, and number of variates. Looking beyond the basic characteristics of the series, we highlight a few of the typical challenging properties of observability time series (several of which are illustrated in Figure 2):
Zero-inflation: Many metrics track infrequent events (e.g., system errors), resulting in sparse series dominated by zeros with rare, informative spikes.
Highly dynamic patterns: Some series fluctuate rapidly, exhibiting frequent sharp transitions that are difficult to model and forecast.
Complex seasonal structure: Series are often modulated by carrier signals exhibiting non-standard seasonal patterns that differ from conventional cyclic behavior.
Trends and abrupt shifts: Metrics may feature long-term trends and sudden structural breaks, which, when combined with other properties, increase forecasting difficulty.
Stochasticity: Some metrics appear pseudo-random or highly irregular, with minimal discernible temporal structure.
Heavy-tailed and skewed distributions: Outliers due to past incidents or performance anomalies introduce significant skew.
High cardinality: Observability data is often segmented by tags such as service, region, or instance, producing large families of multivariate series with high dimensionality but limited history per variate.
Evaluating Models on BOOM
We provide code with example evaluations of existing models; see the code repository.
Dataset Structure
Each entry in the dataset consists of:
- A multivariate or univariate time series (one metric query with up to 100 variates)
- Metadata including sampling start time, frequency, series length and variates number. Figure 3 shows the metadata decomposition of the dataset by number of series.
- Taxonomy labels for dataset stratification:
- Metric Type (e.g., count, rate, gauge, histogram)
- Domain (e.g., infrastructure, networking, security)
Collection and Sources
The data is sourced from an internal Datadog deployment monitoring pre-production systems and was collected using a standardized query API. The data undewent a basic preprocessing pipeline to remove constant or empty series, and to impute missing values.
Comparison with Other Benchmarks
The BOOM Benchmark diverges significantly from traditional time series datasets, including those in the GiftEval suite, when analyzed using 6 standard and custom diagnostic features computed on normalized series. These features capture key temporal and distributional characteristics:
- Spectral entropy (unpredictability),
- Skewness and kurtosis (distribution shape),
- Autocorrelation coefficients (temporal structure),
- Unit root tests (stationarity),
- Flat spots (sparsity).
BOOM series exhibit substantially higher spectral entropy, indicating greater irregularity in temporal dynamics. Distributions show heavier tails and more frequent structural breaks, as reflected by shifts in skewness and stationarity metrics. A wider range of transience scores highlights the presence of both persistent and highly volatile patterns—common in operational observability data but largely absent from curated academic datasets.
Principal Component Analysis (PCA) applied to the full feature set (Figure 1) reveals a clear separation between BOOM and GiftEval datasets. BOOM occupies a broader and more dispersed region of the feature space, reflecting greater diversity in signal complexity and temporal structure. This separation reinforces the benchmark’s relevance for evaluating models under realistic, deployment-aligned conditions.
Links:
- Research Paper
- Codebase
- Leaderboard 🏆
- Toto model (Datadog's open-weights model with state-of-the-art performance on BOOM)
- Blogpost
Citation
@misc{cohen2025timedifferentobservabilityperspective,
      title={This Time is Different: An Observability Perspective on Time Series Foundation Models},
      author={Ben Cohen and Emaad Khwaja and Youssef Doubli and Salahidine Lemaachi and Chris Lettieri and Charles Masson and Hugo Miccinilli and Elise Ramé and Qiqi Ren and Afshin Rostamizadeh and Jean Ogier du Terrail and Anna-Monica Toon and Kan Wang and Stephan Xie and Zongzhe Xu and Viktoriya Zhukova and David Asker and Ameet Talwalkar and Othmane Abou-Amal},
      year={2025},
      eprint={2505.14766},
      archivePrefix={arXiv},
      primaryClass={cs.LG},
      url={https://arxiv.org/abs/2505.14766},
}
- Downloads last month
- 5,355


