GRPO for GUI Grounding Done Right


Estimated reading time: 8 minutes
Reinforcement learning (RL) (e.g., GRPO) helps with grounding because of its inherent objective alignment—rewarding any successful clicks—rather than encouraging long textual Chain-of-Thought (CoT) reasoning (also referred to as “thinking”). In this blog, we will share a complete recipe towards training state-of-the-art GUI grounding models using GRPO.Yan Yang, Dongxu Li, Yuhao Yang, Ziyang Luo, Yutong Dai, Zeyuan Chen, Ran Xu, Liyuan Pan, Caiming Xiong, Junnan Li
Salesforce Research, The Australian National University, University of Hong Kong, Beijing Institute of Technology
🤔 What is GUI Grounding?
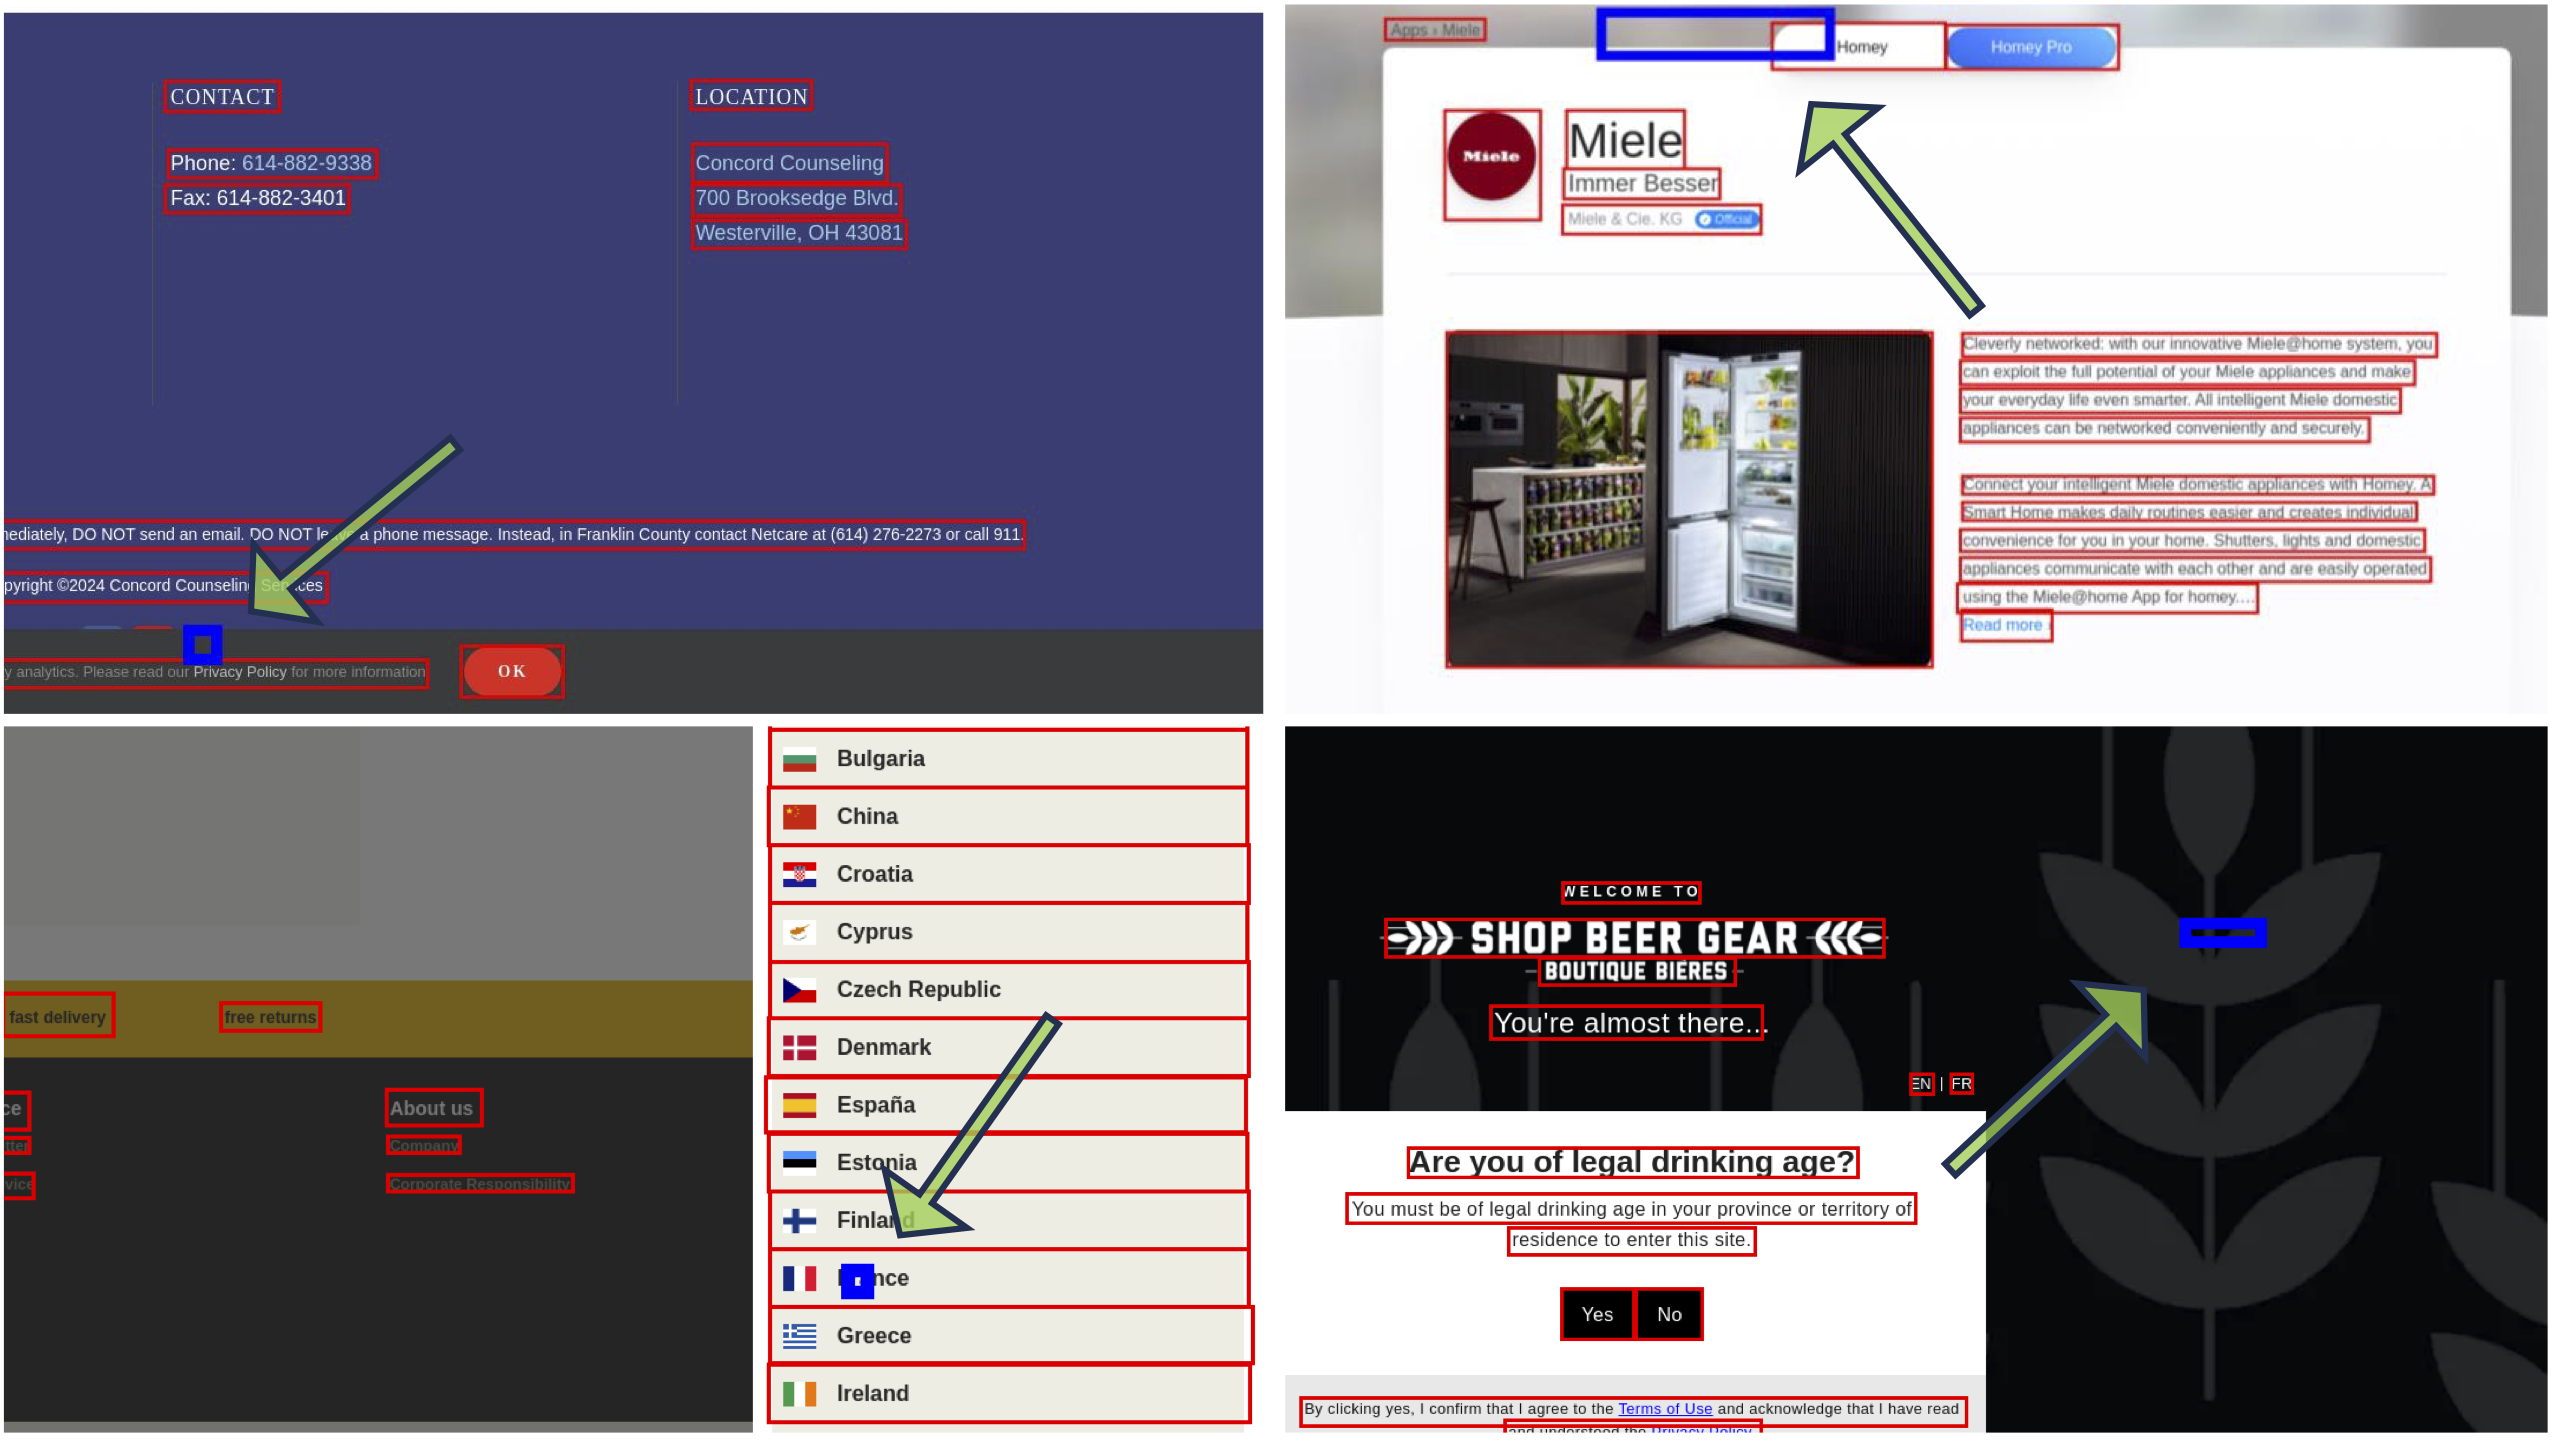
When a graphical user interface (GUI) agent performs a task on behalf of the user, one critical step is grounding, which determines the coordinate to "click" on the UI based on the user instruction. Formally, the task predicts a coordinate on a GUI screenshot image in response to a textual instruction. The goal is to identify and click the correct target element, such as a button, link, or icon, based on the user intent. Below, we provide a specific example.

🧪 Why GRPO?
In GUI grounding, any click within the target element is considered a correct prediction, meaning the output coordinate only needs to fall inside the correct element region. Unlike Supervised Fine-Tuning (SFT), which rigidly trains the model to predict the exact center of the target element, Group Relative Policy Optimization (GRPO) adopts a more flexible approach. It learns to optimize for successful actions, accepting a range of valid clicks within the target area, which better aligns with how real user interaction behaves.

Conventionally, when training a model with GRPO, the model is prompted to reason about the instruction and the image before producing a final answer with an expected output format as:
<think> the textual reasoning process </think>
<answer> the answer to the user instruction </answer>
We refer to the reasoning process enclosed within the <think> tags as the textual Chain-of-Thought (CoT) and "thinking".
📦 GUI Grounding Dataset
To train the model with GRPO effectively, we need a dataset containing:
- Instruction;
- GUI image;
- Target element bounding box (i.e., valid click region).
For example,
 {
  "instruction": "Click menu",
  "image_path": "images/screenshot_001.png",
  "target_bbox": {
    "x_min": 12,
    "y_min": 10,
    "x_max": 42,
    "y_max": 40
  }
}
There are usually three main types of training data:
- Mobile (e.g., Android or iOS apps);
- Desktop (e.g., Windows, Linux applications);
- Web (e.g., browser-based interfaces).
For desktop and web datasets, the data is generally collected via screenshots alongside accessibility tools like A11y or HTML parsers to extract element structure and bounding boxes. However, these bounding boxes may sometimes be misaligned with the visual rendering due to UI animations or timing inconsistencies. In our work, we primarily rely on datasets curated from Aria-UI and OS-Atlas, which we found to be cleaner and better aligned than alternative data collections.
To further improve data quality, we apply a lightweight cleaning strategy:
- Detect all elements on the screenshot using OmniParser;
- Calculate the maximum Intersection over Union (IoU) between each annotated bounding box and the detected element;
- Filter out samples where the target bounding box falls below a predefined IoU threshold.
This helps ensure that training data remains consistent with actual visual targets, reducing noise from misaligned annotations. While this method may occasionally filter out a small number of false positives, we find such cases account for less than 3% of the data. Refer to our code for details.
🛠️ Model Training
We use various open-source models as baseline models (e.g., UI-TARS and Qwen2.5-VL), scaling from 7B to 32B and 72B parameters, and train it with VLM-R1 codebase. The training process can be completed around in approximately 800 H100 GPU-hours over 250 optimization iterations. Here, we share key insights and lessons learned during the training process.
- "Thinking" is not required to achieve strong grounding performance with GRPO. The effectiveness of GRPO primarily comes from its objective alignment—rewarding successful clicks regardless of how they are expressed. In fact, avoiding both "thinking" and KL regularization often leads to more flexible and accurate coordinate predictions. We’ll discuss the trade-offs of using "thinking" in more detail later—it tends to help only in specific scenarios.
- Click-based rewards are sufficient. We experimented with various reward functions (e.g., MSE-based, IoU-based, format rewards for "thinking", and so on). A simple reward that checks whether the predicted point falls inside the target region is enough to achieve strong performance.
- For both “thinking” and “non-thinking” GRPO, performing SFT as a cold start is unnecessary. Qwen2.5-VL and UI-TARS is already sufficiently strong, and SFT prior to GRPO does not yield significant improvements in grounding performance.
- Using a batch size larger than 128. Smaller batches (e.g., 16 or 32) can lead to training instability. For example, if a batch contains only entirely correct or incorrect samples, the reward signal may vanish, cuasing model collapse.
- Sampling 8 responses per instruction is generally sufficient to achieve strong performance. Increasing this number yields diminishing returns. (Important: During sampling, make sure to add “bad words” (i.e., banned tokens) to prevent the model from generating
<img>tokens. On diverse datasets and longer training runs, forgetting this can lead to alignment issues or spurious behavior related to image token generation.) - KL divergence with a reference model is not necessary. Qwen2.5-VL performs strongly on the mobile domain in general. While adding a KL penalty may help retain performance in the mobile setting, it tends to limit exploration in the desktop and web domains.
- The model is not sensitive to learning rate. A peak learning rate of
1e-6generally works well in most settings.

📈 How the Model Perform?
We follow the standard evaluation protocol and benchmark our model on three challenging datasets. Our method consistently achieves the best results among all open-source model families. Below are the comparative results:
| Model | Size | Open Source | ScreenSpot-V2 | ScreenSpotPro | OSWORLD-G |
|---|---|---|---|---|---|
| OpenAI CUA | — | ❌ | 87.9 | 23.4 | — |
| Claude 3.7 | — | ❌ | 87.6 | 27.7 | — |
| JEDI-7B | 7B | ✅ | 91.7 | 39.5 | 54.1 |
| SE-GUI | 7B | ✅ | 90.3 | 47.0 | — |
| UI-TARS | 7B | ✅ | 91.6 | 35.7 | 47.5 |
| UI-TARS-1.5* | 7B | ✅ | 89.7* | 42.0* | 64.2* |
| UGround-v1-7B | 7B | ✅ | — | 31.1 | 36.4 |
| Qwen2.5-VL-32B-Instruct | 32B | ✅ | 91.9* | 48.0 | 59.6* |
| UGround-v1-72B | 72B | ✅ | — | 34.5 | — |
| Qwen2.5-VL-72B-Instruct | 72B | ✅ | 94.00* | 53.3 | 62.2* |
| UI-TARS | 72B | ✅ | 90.3 | 38.1 | — |
| GTA1 (Ours) | 7B | ✅ | 92.4 (∆ +2.7) | 50.1(∆ +8.1) | 67.7 (∆ +3.5) |
| GTA1 (Ours) | 32B | ✅ | 93.2 (∆ +1.3) | 53.6 (∆ +5.6) | 61.9(∆ +2.3) |
| GTA1 (Ours) | 72B | ✅ | 94.8(∆ +0.8) | 58.4 (∆ +5.1) | 66.7(∆ +4.5) |
Note:
- Model size is indicated in billions (B) of parameters.
- A dash (—) denotes results that are currently unavailable.
- A superscript asterisk (﹡) denotes our evaluated result.
- UI-TARS-1.5 7B, Qwen2.5-VL-32B-Instruct, and Qwen2.5-VL-72B-Instruct are applied as our baseline models.
- ∆ indicates the performance improvement (∆) of our model compared to its baseline.
🤔 When "thinking" Help?
Across various static benchmarks, we observe minimal performance differences, usually within 0.5% performance variation between models trained with and without “thinking”. However, they often succeed on different samples, likely due to training instability rather than systematic reasoning gains. Below, we present several examples where either the “thinking” or non-“thinking” model is correct, but not both.


However, we find that "thinking" can be effective in dynamic environments such as AndroidWorld, where the model is provided with the task object, past trajectories, and the user instruction. For example, we trained an in-domain 7B model using the AndroidControl dataset. While grounding performance was similar on the AndroidControl test fold, the task success rate on AndroidWorld increased from 39% to 44% when using "thinking". This improvement is attributed to the increased complexity of the textual prompts (i.e., combination of task object, past trajectories, and the user instruction), which encourages the model to engage in "thinking" when operating under challenging and dynamic conditions.
💬 How SFT compared with GRPO?
To answer this, we trained a 7B model using both SFT and GRPO on the same dataset. The SFT model achieved 90.2 on ScreenSpot-V2 and 42.5 on ScreenSpotPro. In contrast, the GRPO-trained model reached 92.4 and 50.1, respectively. This shows that GRPO offers a substantial performance boost. However, it's important to note that GRPO tends to bring significant improvements only when the base model already exhibits reasonably good performance. If the baseline is too weak, GRPO may struggle due to insufficient reward signal.